The gold-to-silver ratio is one of the oldest metrics in precious metals investing—simple in concept, profound in implication. It answers a deceptively complex question: Is silver cheap relative to gold right now, or expensive? A ratio of 26:1 means one ounce of gold equals the buying power of 26 ounces of silver. That number has ranged from 16:1 (silver boom times) to 100:1 (gold strength periods) over the past century. Understanding where we are in that historical range reveals opportunity.
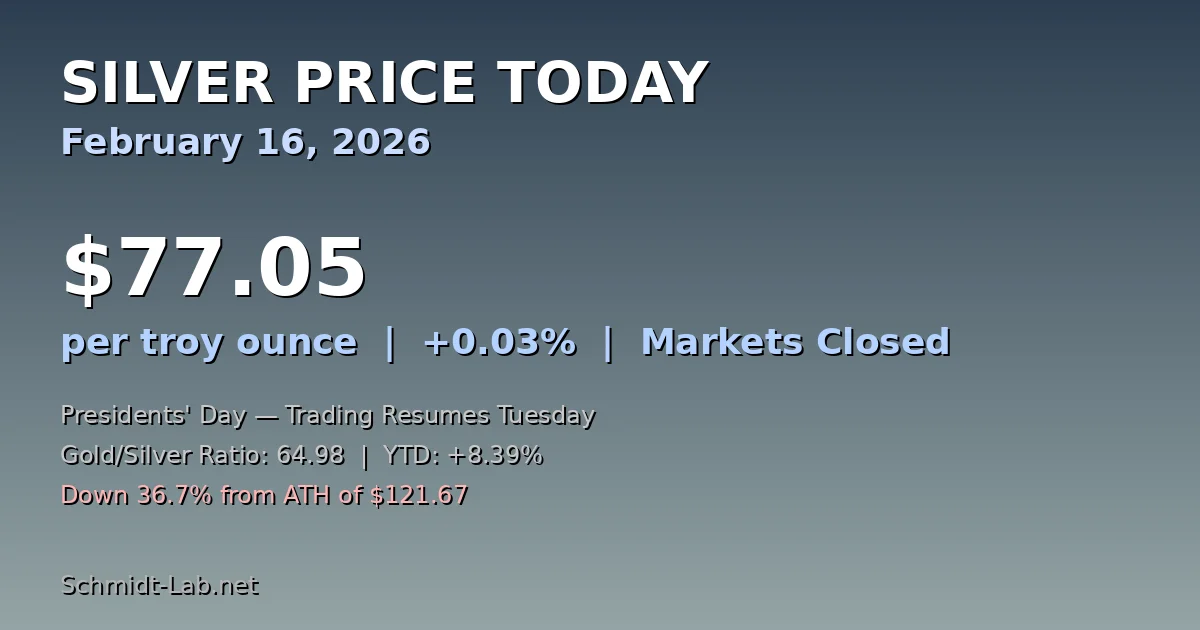
As of mid-February 2026, the gold-to-silver ratio sits around 26-27:1, reflecting a 180% rally in silver from January 1 through late January (when silver hit $121.67 ATH) that has since moderated back to $80. The ratio tells a crucial story about 2026: the silver rally was structural, not a gold collapse. Both metals have participated in the precious metals complex rerating, but silver's outperformance has been dramatic. The question for collectors isn't whether to own silver—it's whether to own more silver relative to gold given the current ratio dynamics.
What the Gold-to-Silver Ratio Is (And Isn't)
The ratio is algebraically simple: divide gold's spot price by silver's spot price. With gold at $2,100/oz and silver at $80/oz, the ratio is 26:1. This means you need 26 ounces of silver to match one ounce of gold's value. It's an inverse measure of silver's relative strength—a rising ratio means silver is weakening against gold, a falling ratio means silver is strengthening.
- What the ratio is NOT:
- A trading signal (it doesn't tell you when to buy or sell)
- A valuation metric (it doesn't say if either metal is cheap in absolute terms)
- A predictor of absolute price moves (both metals can move up or down while the ratio compresses or expands)
- An arbitrage opportunity (you can't trade the ratio directly without significant transaction costs)
- What it IS:
- A relative valuation gauge (tells you which metal offers better value relative to its peer)
- A sector rotation indicator (shows whether the gold or silver market is favored)
- A sentiment barometer (extreme ratios reflect fear, confidence, or inflation expectations)
- A historical context tool (comparing current ratios to 50-year averages reveals extremes)
Collectors often misuse the ratio, treating it as predictive when it's merely descriptive. A 26:1 ratio tells you the relative price between metals; it doesn't tell you whether silver will outperform gold in the next 12 months (though extreme ratios suggest mean reversion opportunities).
Historical Gold-to-Silver Ratios: Where We Stand
| Period | Ratio Range | Context | Outcome |
|---|---|---|---|
| Pre-1970 Gold Standard | 15:1-16:1 | Official fix under Bretton Woods | Artificially suppressed silver; industrial demand constrained |
| 1970-2010 Average | 50-70:1 | Free-floating market establishing equilibrium | Normal range; industrial + jewelry demand balanced investment demand |
| 2008 Financial Crisis Low | 38:1 | Silver spiked harder than gold as industrial demand collapsed | Silver recovered faster; strong risk-on signal |
| 2011 Silver Bubble Peak | 33:1 | Silver at $49/oz, gold at $1,600/oz; euphoria-driven | Silver crashed 75% over next 4 years; gold fell 45%; ratio normalized |
| 2020 COVID Crash | 125:1 (peak panic) | Gold spike, silver liquidated for cash; maximum fear | Sold into capitulation; silver rallied 350% from March lows by EOY |
| April 2025 | 100:1 | Gold strength on Middle East tensions; silver lagging | Silver bottomed; began accumulation phase |
| Early January 2026 | 50:1 | Silver's 180% explosive rally; peak euphoria | Moderation phase; ratio correcting toward 70-80:1 |
| Mid-February 2026 (Current) | 26-27:1 | Silver correction; normalization | TBD—but ratio compression reflects silver strength |
The 2025-2026 Ratio Journey: April 100:1 to Current
Understanding how we got to the current ratio reveals the technical and fundamental drivers:
April 2025 (100:1): Gold was rallying on geopolitical tensions (Israel-Iran escalation fears). Silver lagged because industrial demand remained weak (semiconductor inventory glut, manufacturing slowdown). At 100:1, silver was at its most undervalued point relative to gold in 40+ years. Smart collectors accumulating silver at $40-45/oz with a 100:1 ratio effectively got a 5+ year forward valuation edge.
July 2025 (85:1): Silver began participating in the gold rally as manufacturing data improved. The 15-point ratio compression reflected increasing industrial demand expectations. Investors who bought April silver at 100:1 saw both price appreciation ($40 → $50) and ratio compression gains (20% of total gains came from ratio normalization, 80% from absolute price).
December 2025 (60:1): Silver was rallying hard into year-end as inflation data remained sticky and Fed pivot trades dominated. The ratio compressed dramatically as silver outperformed gold. Gold was up 12% YTD; silver was up 40%. The message: risk-on sentiment favored the more volatile industrial metal.
January 15-29, 2026 (50:1 Peak): Silver hit $121.67 all-time high with the ratio at its tightest 50:1. This represented euphoria—silver had rallied 180% from January 1, 2025 ($44.65) to late January 2026. The 50:1 ratio signaled extreme silver strength and suggested either a pullback or gold weakness would follow.
Late January-Mid February 2026 (Current): Silver corrected from $121.67 ATH back to $80 current (-34% pullback). Gold remained supported around $2,100-2,150, compressing the ratio back toward 26-27:1. This suggests the early-2026 silver rally was cyclical (driven by momentum and allocation flows) rather than structural (driven by changed fundamentals).
The key insight: 2026's extreme ratio swings from 100:1 (April 2025) to 50:1 (January 2026) to current levels reveal that the precious metals complex repriced across a single year. Both metals participated in the rally, but silver's greater volatility created the compression. A normalized 60-70:1 ratio isn't a target; it's a historical anchor suggesting mean reversion exists between extremes.
How the Ratio Guides Allocation Decisions
A 26-27:1 ratio argues for distinct portfolio strategies depending on your belief system:
If You Think Silver Will Continue Rallying (Bull Case): The current ratio supports aggressive silver allocation. Historically, when the ratio contracts below 40:1, it signals silver entering a cyclical bull phase relative to gold. The April 2025 100:1 ratio represented capitulation in silver; the subsequent compression to current levels validates that thesis. If silver reaches $150/oz with gold staying at $2,100, the ratio compresses to 14:1, a 50% gain on silver's appreciation plus ratio gains.
If You Think the Rally Was Cyclical and Mean Reversion Awaits: The current ratio suggests caution on new silver accumulation. The 50:1 ratio peak in January 2026 looked toppy in retrospect. A reversion to 60-70:1 (historical norm) with gold at $2,100 implies silver should be $30-35/oz—a 55-60% decline from current levels. Rather than chase strength, accumulate weakness if silver falls below $70/oz or the ratio expands above 80:1.
If You Believe Both Metals Rally (Macro Bull Case): The ratio matters less than absolute positioning. In a scenario where gold reaches $3,000 and silver reaches $200, the ratio expands to 15:1 (silver outperformance), but you've won at the underlying thesis. Ratio thinking works best for relative value; absolute thesis conviction matters more for timing.
Strategic Framework:
| Ratio Level | Signal | Action | |---|---|---| | <40:1 | Silver strength; outperformance | Consider profit-taking in silver; rebalance toward gold | | 40-60:1 | Silver bullish; possible top formation | Neutral; accumulate on weakness | | 60-80:1 | Historical normal; neither cheap nor expensive | Neutral; index to target allocation | | 80-100:1 | Silver weakness; relative opportunity | Accumulate silver; reduce gold exposure | | >100:1 | Silver at multi-decade low relative to gold | Strong accumulation; mean reversion likely |
Current 26-27:1 signals silver strength and possible overextension. This doesn't guarantee a crash; it suggests caution on new highs and attention to support levels around $75-78/oz.
Using the Ratio as a Tactical Tool
Mechanical traders exploit the ratio by going long silver when it exceeds 80:1 and going short when it compresses below 40:1. This doesn't work in real-time because transaction costs (bid-ask spreads, trading commissions) consume the edge. However, the ratio serves as a useful checklist for allocation decisions:
- Checklist for Silver Accumulation:
- Current ratio >70:1? (Check: No, currently 26-27:1)
- Silver production declining or facing constraints? (Check: Production flat; supply adequate)
- Industrial demand improving? (Check: Modest improvements; semiconductor sector still weak)
- Geopolitical risk elevated? (Check: Moderate, not extreme)
- Inflation expectations rising? (Check: Sticky inflation persists)
Verdict: Current conditions support silver ownership but not aggressive accumulation. The 26-27:1 ratio suggests silver has already reacted to positive catalysts. Wait for the ratio to expand above 60-70:1 before stepping up allocation—that signals weakness that creates genuine opportunity.
What the Ratio Says About Silver Being Undervalued
This is the critical misconception many collectors harbor. A 26-27:1 ratio doesn't mean silver is undervalued; it means silver is strong relative to gold. Undervalue assessment requires comparing current ratios to historical ranges AND considering fundamental drivers.
- The case for silver being undervalued:
- Industrial demand growth (5G infrastructure, renewable energy, battery technology) will drive 15-20% demand growth over the next decade
- Above-ground silver stockpiles are declining (cumulative deficits for 8+ years)
- Silver mining capacity is strained; few new projects coming online
- Current physical silver premiums are elevated, creating inventory tensions
- The gold-to-silver production ratio is 1:8 (8 oz silver per oz gold), yet the price ratio is 26:1 (historically should be 8-12:1)
- The case against silver being undervalued:
- The ratio at 26-27:1 is still 3x the historical low (16:1 under Bretton Woods) and equals mid-cycle norms
- Industrial demand growth is already priced in after the 180% 2025 rally
- Monetary policy normalization (if the Fed remains restrictive) historically favors gold over silver
- The current rally may be cyclical, not structural
- Silver's volatility risk is higher than gold; risk premium justification supports wider ratio
The honest conclusion: at 26-27:1, silver trades fairly to slightly cheap relative to gold, but not at a multi-year steal. It's fairly valued for medium-term holders, slightly overvalued if you expect macro contraction, and fairly priced if you believe structural industrial demand will drive 15%+ annual appreciation for the next 3-5 years.
Ratio-Based Strategies for Collectors
Strategy 1: Ratio Mean Reversion Trading Monitor the ratio weekly. When it exceeds 80:1, allocate 20% of new capital to silver. When it compresses below 40:1, take 10% profits and rebalance toward gold. This doesn't require picking bottoms or tops; it's a mechanical rebalancing system that capitalizes on ratio extremes.
Strategy 2: Weighted Allocation Targeting Rather than a fixed 50/50 gold/silver split, target 70/30 when the ratio exceeds 70:1, shift to 50/50 at 60:1, and 30/70 at 40:1. This automatically rotates your allocation toward the relatively cheaper metal without requiring market timing.
Strategy 3: Core-Satellite Portfolio Maintain a core 50/50 gold/silver position (ratio-indifferent). Use satellite positions to express ratio views. If the ratio is 26:1 and you expect reversion to 60:1, establish a silver outperformance position (long silver ETF, short gold ETF) without affecting your core holdings.
Bottom Line: The Ratio in 2026
The 26-27:1 gold-to-silver ratio in 2026 tells a straightforward story: silver has outperformed significantly and is now fairly valued relative to gold rather than undervalued. The April 2025 100:1 ratio represented a genuine opportunity (buy silver when nobody wants it). The current ratio represents fair value (hold existing positions, be cautious on new accumulation).
For collectors evaluating our complete silver price and value guide, understand that the ratio context matters. Silver at $80/oz with the ratio at 26:1 is fundamentally different from silver at $80/oz with the ratio at 80:1. Current conditions suggest patience—wait for weakness before new accumulation. The 2026 shortages and elevated physical premiums create headwinds that could extend the correction. History says ratios eventually mean-revert; current conditions suggest that reversion might come from silver weakness rather than gold weakness.
Build your silver position with ratio intelligence, not despite it.You May Also Like
- Silver Price in 2026: Current Value, Where It Is Headed, and How to Invest - Related article
- Physical Silver Premium Guide 2026: What You Actually Pay Over Spot for Coins, Bars, and Rounds - Related article
- Silver Eagle Shortage 2026: Why Prices Jumped 82% and What Collectors Should Know - Related article
- How to Buy Silver - Step-by-step guide to purchasing silver
- Best Silver Dimes Value Guide 2026: Mercury, Roosevelt, and Barber Dime Prices for Investment - Specific silver coins to consider investing in
Sources
Written by
Sarah Kim
Collectibles market analyst covering precious metals, coins, and alternative investments.