Silver prices move every trading day, and understanding the spot price is essential whether you're investing, collecting, or hedging your portfolio. Unlike stocks that trade during set hours, silver prices update continuously across global markets from Tokyo to London to New York, reflecting real-time demand and macroeconomic conditions.
Live Silver Spot
USD per troy ounce • source: RapidAPI (real-time-metal-prices)
Updated just now. Refreshes every 60 seconds.
What Is the Silver Spot Price?
The spot price is the current market rate for one troy ounce of pure silver for immediate delivery. It's the wholesale price where large institutional buyers and sellers transact on commodity exchanges. When you see "$80 per ounce," that's the spot price—the benchmark that all other silver pricing derives from.
Silver trades 23 hours per day across multiple time zones. The London Bullion Market opens first, followed by COMEX (Commodity Exchange in New York), which dominates trading volume. A single troy ounce of silver contains 31.1 grams of pure metal, and the spot price reflects demand from industrial users, investors, central banks, and speculators simultaneously.
Spot Price vs. Premium: What You Actually Pay
When you buy physical silver—coins, bars, or ingots—you don't pay the spot price. You pay spot plus a premium. Here's why this matters:
Spot Price = Raw commodity trading price on exchanges = $80/oz (for example)
Retail Price = Spot Price + Premium = $80 + $12-$20 = $92-$100/oz
- The premium exists because physical silver requires:
- Refining and purification (spot assumes 99.9% purity)
- Minting or striking into coins/bars
- Quality assurance and grading
- Packaging and storage
- Transportation and insurance
- Dealer overhead and profit margins
A standard American Silver Eagle coin might carry a 15-20% premium above spot. A generic 1-ounce silver bar might be 10-15%. Rare numismatic coins can have premiums exceeding 100% due to historical scarcity and collector demand.
How the Silver Spot Price Is Set
Silver prices aren't determined by a central authority. Instead, they emerge from continuous price discovery on exchanges where millions of ounces trade daily.
- LBMA Price Fix (London Bullion Market Association):
- Established twice daily: 10:30 AM and 3:00 PM London time
- Brings together major bullion dealers to establish benchmark prices
- Used as a reference for professional transactions globally
- More transparent than OTC markets, less volatile than futures trading
- COMEX Silver Futures (CME Group):
- Primary price discovery mechanism in the United States
- Trading occurs 23 hours per day, Sunday evening through Friday afternoon
- One contract = 5,000 troy ounces
- Active participation from hedge funds, miners, refiners, and speculators
- Most liquid market with tightest bid-ask spreads
- OTC Markets (Over-the-Counter):
- Direct dealer-to-dealer transactions
- Less transparent but substantial volume
- Prices track closely to COMEX and LBMA fixes
The spot price you see quoted reflects the most recent transaction on COMEX or a dealer's estimate of the bid-ask midpoint. During market hours, the price updates every few seconds as new trades occur.
Silver Price Trends: Recent Performance
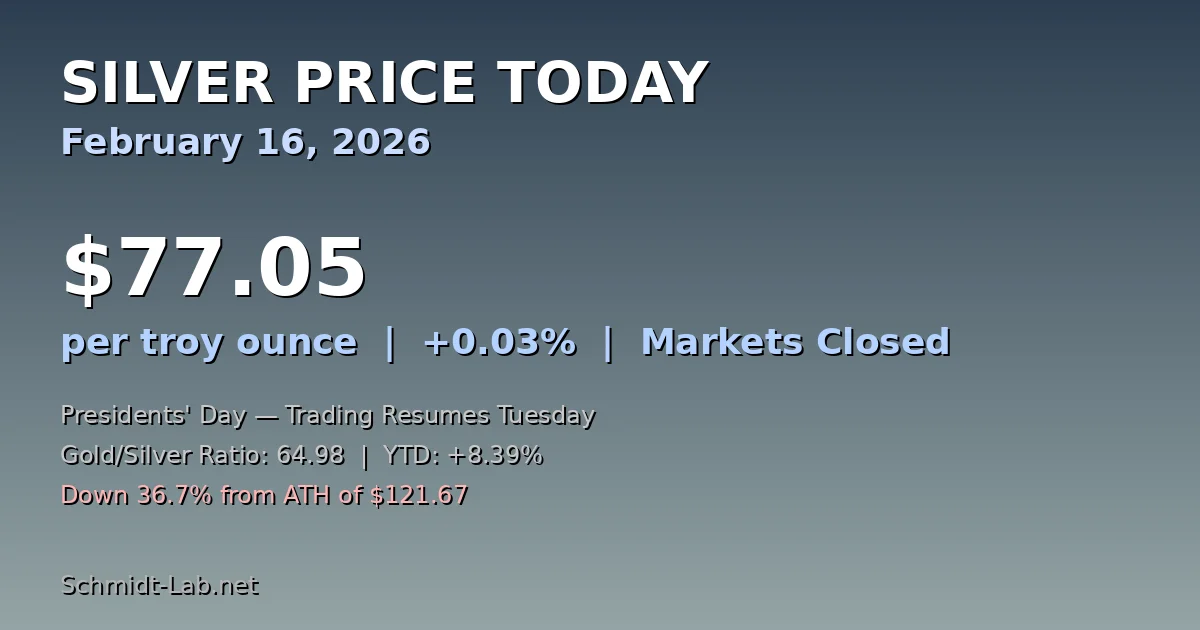
Silver reached an all-time high of $121.67 on January 29, 2026, driven by supply deficit awareness, central bank purchases, and industrial demand surge. As of mid-February 2026, prices have consolidated around $80/oz, reflecting profit-taking and macro volatility.
The broader context: Silver was trading near $30/oz at the start of 2025, making the current price approximately 180% higher in just 13 months. This rally exceeds the 2010-2011 bull market and represents genuine structural supply-demand fundamentals rather than pure speculation.
Live Silver Spot
USD per troy ounce • source: RapidAPI (real-time-metal-prices)
Updated just now. Refreshes every 60 seconds.
Historical Silver Price Table
| Time Period | Price (Low) | Price (High) | Context |
|---|---|---|---|
| January 1980 | $8.50 | $49.45 | Hunt Brothers squeeze attempt; high inflation era |
| 2001 Low | $3.84 | N/A | Post-tech bubble; deflationary concerns |
| 2011 Peak | $48.75 | N/A | Post-2008 QE; inflation expectations peaked |
| 2020 Bottom | $11.65 | N/A | COVID-19 crash; demand collapsed temporarily |
| January 2026 | $30 | $121.67 | Record high; supply deficit + industrial demand |
What Drives the Daily Silver Spot Price?
Silver prices respond to multiple factors simultaneously:
- Macroeconomic Conditions
- Federal Reserve policy and interest rate expectations
- Inflation data and CPI releases
- Dollar strength (inverse relationship to silver prices)
- Global economic growth forecasts
- Industrial Demand
- Solar panel manufacturing (185-240 million ounces annually)
- Electronics and semiconductor production
- Electric vehicle production (90+ million ounces annually)
- Photography and chemical applications
- Investment Demand
- ETF inflows/outflows (SLV, PSLV tracking spot prices)
- Central bank purchases (particularly China, Russia, India)
- Retail coin and bar demand
- Jewelry manufacturing
- Supply Factors
- Mining production (71% of silver comes as byproduct of copper, gold, zinc mining)
- Recycling and scrap supply
- Above-ground inventory levels
- Geopolitical disruptions to mining regions
- Sentiment & Speculation
- Risk appetite in financial markets
- Precious metals fund flows
- Futures positioning (CFTC reports show large speculative positions)
- Retail investor interest
Converting Spot Price: Ounces, Grams, and Kilograms
The spot price quotes per troy ounce, but you may need it in other units:
- From Spot Price per Troy Ounce:
- Per Gram = Spot ÷ 31.1 (1 troy oz = 31.1 grams)
- - Example: $80/oz ÷ 31.1 = $2.57/gram
- Per Kilogram = Spot × 32.15 (1 kg = 32.15 troy oz)
- - Example: $80/oz × 32.15 = $2,572/kg
- Practical Conversions:
- 1 kilogram = ~32 troy ounces = ~$2,560 at $80/oz
- 100 grams = ~3.2 troy ounces = ~$256 at $80/oz
- 1 pound (avoirdupois) = ~14.58 troy ounces = ~$1,166 at $80/oz
Where to Check Current Silver Prices
- Real-Time Trading Platforms
- COMEX futures on TD Ameritrade, E*TRADE, or Interactive Brokers
- Bloomberg Terminal (professional traders)
- Kitco.com (live price with dealer quotes)
- Dealer Price Quotes
- APMEX (American Precious Metals Exchange)
- JM Bullion
- Provident Metals
- SD Bullion
- Local coin and bullion dealers
- Tracking Resources
- Silver Spot Price widgets (update every 60 seconds)
- Trading View charts (free charting platform)
- LBMA official price fixes (published daily)
- CME Group futures data (official source)
Key Consideration: Dealer websites quote both spot prices and their retail premiums. The spot price is informational; your actual purchase price will be higher due to dealer markup and premium.
Using Spot Price Information for Silver Investing
- Understanding the spot price helps you:
- Evaluate dealer markup – Compare quotes against current spot to identify fair premiums
- Time purchases – Know when premiums are abnormally high (avoid those times)
- Track portfolio value – Multiply your ounces by spot price for net metal value
- Understand profit and loss – Calculate true gains above spot price appreciation
- Compare investments – Evaluate silver versus other assets using real pricing data
For a comprehensive guide to silver pricing, valuation, and investment strategy, see our complete silver price and value guide.
The spot price is your anchor to reality in the precious metals market. By understanding how it's set, what drives it, and how it translates to what you pay, you make more informed decisions whether buying physical silver or trading futures contracts.You May Also Like
- Silver Price in 2026: Current Value, Where It Is Headed, and How to Invest - Related article
- How High Will Silver Go in 2026? Price Ceiling Analysis and Forecasts - Related article
- Where Is Silver Headed in 2026? Outlook After the Biggest Rally in Decades - Related article
Sources
Written by
Sarah Kim
Collectibles market analyst covering precious metals, coins, and alternative investments.